
나그네소
Postgres Sql Tuning 본문
Postgresql & EDB 관련 Sql 튜링 관련 부분을 기록 한다.
1. postgresql Architecture
공유 메모리, 매우 적은 수의 백그라운드 프로세스와 데이터파일로 구성된다.

2. Postgresql Sql Cache
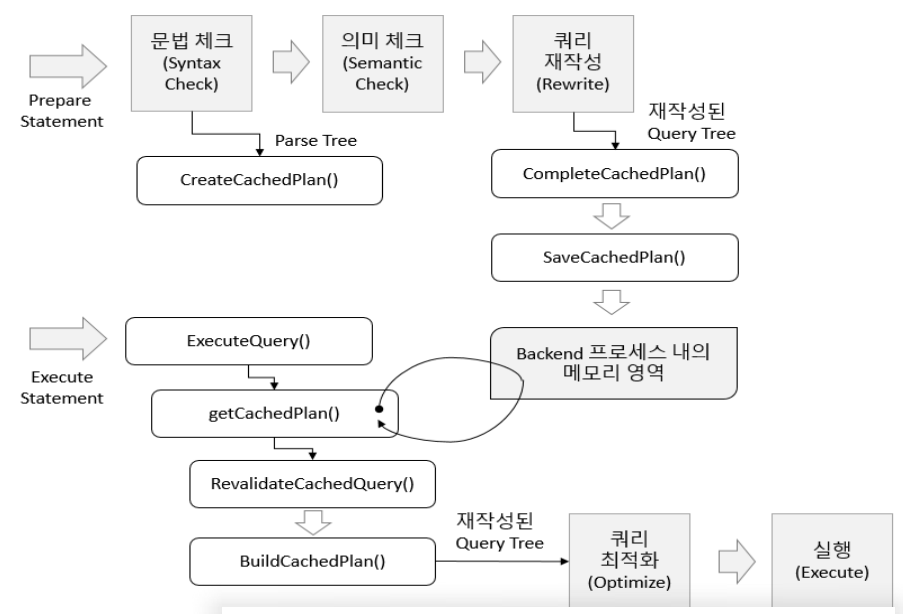
Postgresql SQL Cache가 없어 개별 적으로 Session에서 Plan Cache 기능으로 처리 한다.개별 적으로 Plan Cache가 있기 때문에 해당 Session의 Plan이 다른 Session에서 발생 하게된다면 Plan를 새로운 세션에서 다시 만들어야 한다.
prepare Stmt 수행 구조를 살펴본다.
3. Backend Processor Memory 관련 파라미터
- work_mem
- 정렬 작업, Bitmap 작업, 해시 조인과 Merge 조인 작업 시에 사용되는 공간이다. 기본 설정값은 4 MiB이다.
- maintenance_work_mem
- Vacuum 및 CREATE INDEX 작업 시에 사용되는 공간이다. 기본 설정값은 64 MiB이다.
- temp_buffers
- Temporary 테이블을 저장하기 위한 공간이다. 기본 설정값은 8 MiB이다.
위의 세가지 Property 항목이 Memory 관련 연관 있는 항목이니 튜닝시 조절을 하면 테스트 해본다.
4. Shared Buffer Tuning
Shared Buffer의 목적은 DISK IO를 최소화함으로써 IO 성능을 향상하는 것이다.
2) 많은 사용자가 동시에 접근할 때 경합을 최소화해야 한다.
3) 자주 사용되는 블록은 최대한 오랫동안 버퍼 내에 있어야 한다.
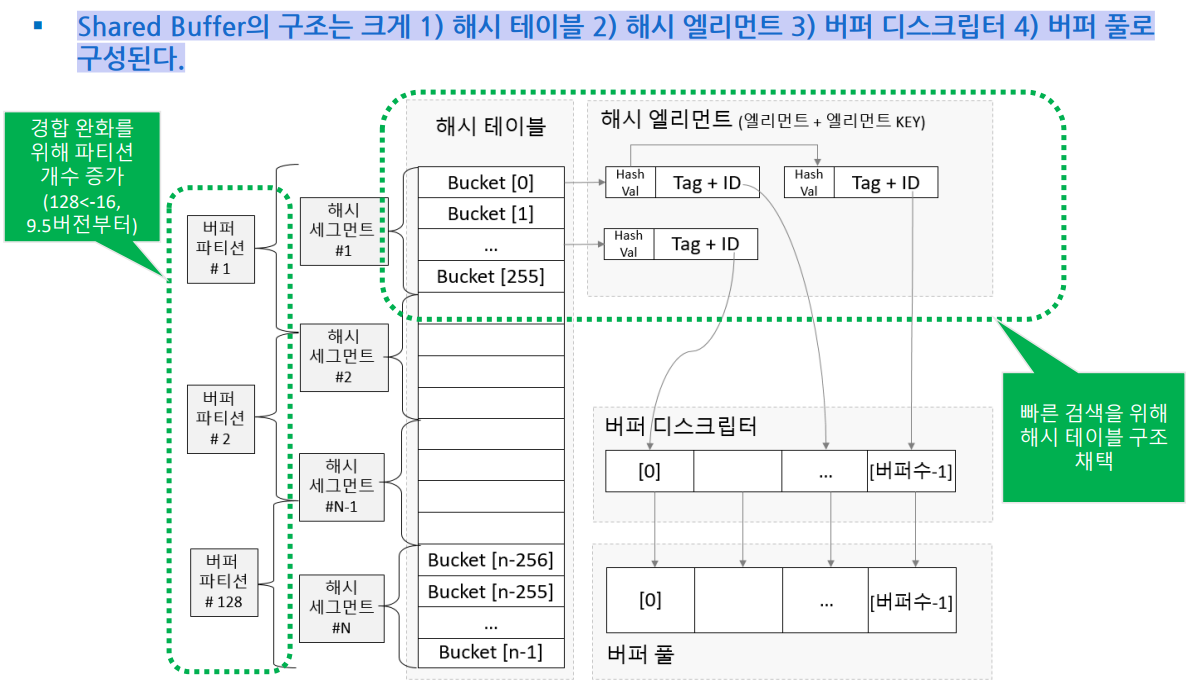
4-1) Shared Buffer 구조
Shared Buffer의 구조는 크게 1) 해시 테이블 2) 해시 엘리먼트 3) 버퍼 디스크립터 4) 버퍼 풀로 구성된다.
5. pg_prewarm
postgreSQL Comunity에는 extension이 없고 EDB에는 있는 항목이다.
주의 : Bulck성 Update 항목에 효과가 좋다고 했는데 무조건 그런것은 아니다. 항시 테스트 해보고
결정을 해야 한다.
▪ Shared Buffer의 ¼보다 큰 테이블도 로딩이 가능하다.
▪ 1회성 작업이다. 따라서 Batch 작업 전에 적절히 사용하면 IO 향상에 큰 효과를 낼 수 있다.MVCC
실제 해보면 성능이 느리게 나오는 경우도 있다. 정상 적으로 테스트를 해보고 수행 해야 할 것으로 보인다.
5-1) 문법
create extension pg_prewarm;
select pg_prewarm('t1');
5-2) pg_prewarm TEST
mydb=> create table t2  (c1 int, c2 char(1000), c3 char(100), c4 char(100));
mydb=> insert into t2 select i, 'data', 'data','data' from pg_catalog.generate_series(1, 3000000) a(i);
mydb=> explain (costs false, buffers, analyze)
select count(*) from t2;
                               QUERY PLAN
-------------------------------------------------------------------------
Aggregate (actual time=2152.157..2152.158 rows=1 loops=1)
   Buffers: shared hit=120964 read=379036
   ->  Seq Scan on t2 (actual time=0.346..1943.583 rows=3000000 loops=1)
         Buffers: shared hit=120964 read=379036
Planning Time: 0.181 ms
Execution Time: 2158.923 ms

mydb=> select pg_prewarm('t2');
pg_prewarm
------------
     500000

mydb=> explain (costs false, buffers, analyze)
select count(*) from t2;
                                          QUERY PLAN
----------------------------------------------------------------------------------------------
Finalize Aggregate (actual time=2723.651..2723.758 rows=1 loops=1)
   Buffers: shared hit=120975 read=379025
   ->  Gather (actual time=2714.945..2723.734 rows=3 loops=1)
         Workers Planned: 2
         Workers Launched: 2
         Buffers: shared hit=120975 read=379025
         ->  Partial Aggregate (actual time=2671.966..2671.967 rows=1 loops=3)
               Buffers: shared hit=120975 read=379025
               ->  Parallel Seq Scan on t2 (actual time=4.090..2445.287 rows=1000000 loops=3)
                     Buffers: shared hit=120975 read=379025
Planning Time: 0.058 ms
Execution Time: 2724.317 ms있을 것으로 보인다.
6. HOT / Heap Only Tuple
테이블 생성 시 Index 사용률의 fillfactor 이용하여 튜링을 한다.
7. fillfactor
Index Leaf Node Key 저장할 수 있는 비율롤 default 90으로 되어 있다.
create table t1 (c1 integer, c2 integer) WITH (fillfactor=50);

select relname, reloptions
  from   pg_class
where  relname = 't1’;
relname |   reloptions
---------+-----------------
t1      | {fillfactor=50}
: 첨부한 엑셀 파일을 참고 하면 되겠지만 일단 virtualbox에서 테스트 시 성능 차이가 fillfactor 50 / fillfactor 90 비교 시
나지 않았다. 물론 virtualbox 물리적인 한계 및 hypervisor 거치 고 network를 한다계 더 거치기 때문에 성능의
정확도는 신뢰 할 수 없기는 하지만 일단 장비가 없으니 테스트 한 결과만 보자면 성능 차이가 없다는 것을 알 수
있다.
- Insert
- Update
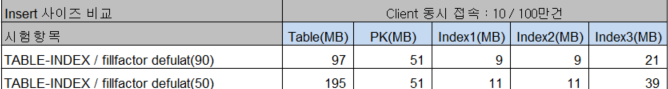
- Insert /Update Size 비교 fillfacotr (90/50)
- fillfacotr (90/50) 비교 시 50으로 하였을 때 사이즈가 증가한 것을 알 수 있다.
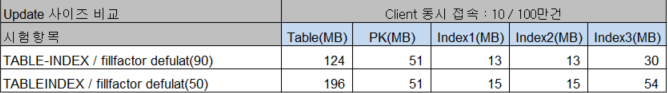
- Insert -> update 사이즈 체크
- Insert 처리 후 Update 처리 시 Table만이 아니라 Index에서 size가 증가 하였다. update 시에도 버져링
(out-place-update) data가 발생 하여 데이터값이 증가 하는 것으로 보인다.
- Insert 처리 후 Update 처리 시 Table만이 아니라 Index에서 size가 증가 하였다. update 시에도 버져링
> full scan test
mydb=> explain (costs false, buffers, analyze)
select * from t_pg_ads_lte_session_info where identifier = 'xxxx999999';

> fillfactor(90)
                                             QUERY PLAN
----------------------------------------------------------------------------------------------------
Gather (actual time=179.320..183.166 rows=1 loops=1)
   Workers Planned: 2
   Workers Launched: 2
   Buffers: shared hit=37051
   ->  Parallel Seq Scan on t_pg_ads_lte_session_info (actual time=122.146..160.729 rows=0 loops=3)
         Filter: ((identifier)::text = 'xxxx999999'::text)
         Rows Removed by Filter: 1000000
         Buffers: shared hit=37051
Planning Time: 0.065 ms
Execution Time: 183.184 ms


> fillfactor(50)
----------------------------------------------------------------------------------------------------
Gather (actual time=237.491..241.073 rows=1 loops=1)
   Workers Planned: 2
   Workers Launched: 2
   Buffers: shared hit=75000
   ->  Parallel Seq Scan on t_pg_ads_lte_session_info (actual time=172.437..216.865 rows=0 loops=3)
         Filter: ((identifier)::text = 'xxxx999999'::text)
         Rows Removed by Filter: 1000000
         Buffers: shared hit=75000
Planning Time: 0.083 ms
Execution Time: 241.093 ms

: Filter는 동일하게 1000000건인데 i/o block 횟수의 차이로 인해 성능차가 발생한다.
: fillfactor 성능은 차이가 없고 full scna일 때 fillfactor크면 테이블 블록 access가 적어져 성능이 더 좋다.
8. CBO
SQL 수행 시 비용 관련 부분을 Cost 측정하여 Plan 에 기록하여 분석 할 때 사용한다.
(참고 : 예측치 이기에 저자는 cost false로 사용해 본 적이 거의 없다.)
8-1) CBO란?
- 파라미터와 로직을 이용해서 계산된 숫자
- COST 값으로 IO 블록 수와 CPU 사용 시간을 계산할 수는 없음
- 단지, COST가 낮을수록 효율적이고, 높을수록 비효율적이라고 추정함
8-2) cost 계산에 이용 되는 파라메터
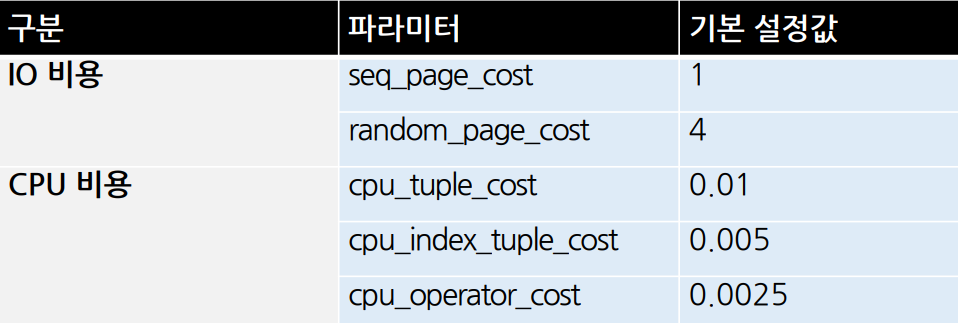
-
seq_pate_costseq scan 방식으로 1븍록을 읽는 비용
-
random_page_cost
-
index scan 방식으로 1 블록을 읽는 비용
-
인덱스 root 블록과 Rranch 블록을 제외
-
-
cpu_tuple_costseq scan 수행 시에 1개 레코드를 액세스하는 비용
-
cpu_index_tuple_cost
index scan 수행 시에 1개 레코드를 액세스하는 비용 -
cpu_operatior_cost
레코드 1개를 필터 처리 하는 비용
8-3) seq scan 비용 예제
mydb=# select relpages, reltuples from pg_class where relname='t_pg_ads_lte_session_info';
relpages | reltuples
----------+-----------
    15584 |    999820

mydb=# select relpages * current_setting('seq_page_cost')::float +
mydb-#        reltuples * current_setting('cpu_tuple_cost')::float
mydb-# from pg_class where relname='t_pg_ads_lte_session_info';
?column?
----------
  25582.2

mydb=# explain select * from t_pg_ads_lte_session_info;
                                     QUERY PLAN
------------------------------------------------------------------------------------
Seq Scan on t_pg_ads_lte_session_info  (cost=0.00..25948.27 rows=1014127 width=87)
'Open Source DB > PostgreSQL Comunity' 카테고리의 다른 글
| Postgresql ODBC 사용법 (0) | 2022.11.08 |
|---|---|
| PG_HINT(Postgresql Comunity) (0) | 2022.10.27 |
| postgresql comunity 개념 (0) | 2022.09.15 |

